Immediately after paying for the XARD FX SYSTEM, you received a confirmation letter in which you will find a link to download this product and a manual.
If you need to unpack the archive with the product, then use any archiver program or this free one – https://www.7-zip.org/
So, you need to unpack the archive with the product and then follow the instructions below.
Set the indicator into the trading platform:
You need to open the root directory of your Metatrader 4 platform. To do this, click on the “File” menu button and select “Open data folder” in the drop-down menu:

Next – Drag the folders from the archive that you received after the purchase with the mouse cursor to the root directory of your MT4 platform that you have opened:

Reboot your trading platform so that the indicator appears in the internal menu:


At the top of your platform, click on the “Templates” button and select the “X-XARD FX” system template from the drop-down menu. After applying this template, your quotes chart will change like this:

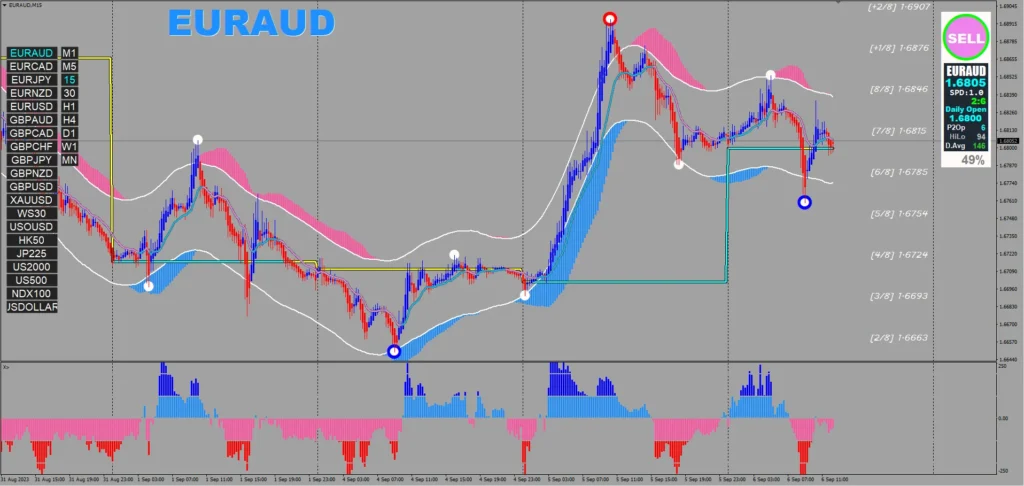
How to trade?
This system first of all shows you the main trend line, the change of which will determine the future direction of the trade.
So, if this line is blue, then the trend is considered to be growing and you can only trade BUY. If this line is yellow, then this is a downtrend and you can only trade SELL:

Next, wait until a circle appears on the quotes chart, indicating the appearance of a trend reversal:

Example of a trade on BUY:
- the indicator in the lower separate window showed an acceleration of price growth in the upward direction (the histogram bars are colored in dark blue)
- the quote candle has crossed the main trend line and is above this line
- a few price candles before this was preceded by a trend reversal signal (a blue circle appeared)
- the main trend line is colored blue
Make a trade on BUY and place a 100 Loss order at the level of the lower border of the price channel. Take profit set at the border of the upper line of the price channel.

The price channel will shift as the market moves. However, you do not need to move Stop Loss and Take Profit orders following the movement of the channel borders. Accordingly, for deals on SELL, they have the opposite interpretation.
Timeframe and assets for trading
We advise you to use the M15 timeframe. On this timeframe, we will receive quite a lot of trading signals.
As for assets, you can find a list of them on the sidebar of this system on the left side of the quote chart window on which you installed the trading template.
We advise you to install this system for at least 5-7 asset windows in this case, you will receive many trading signals during the day and, accordingly, receive a lot of profit.