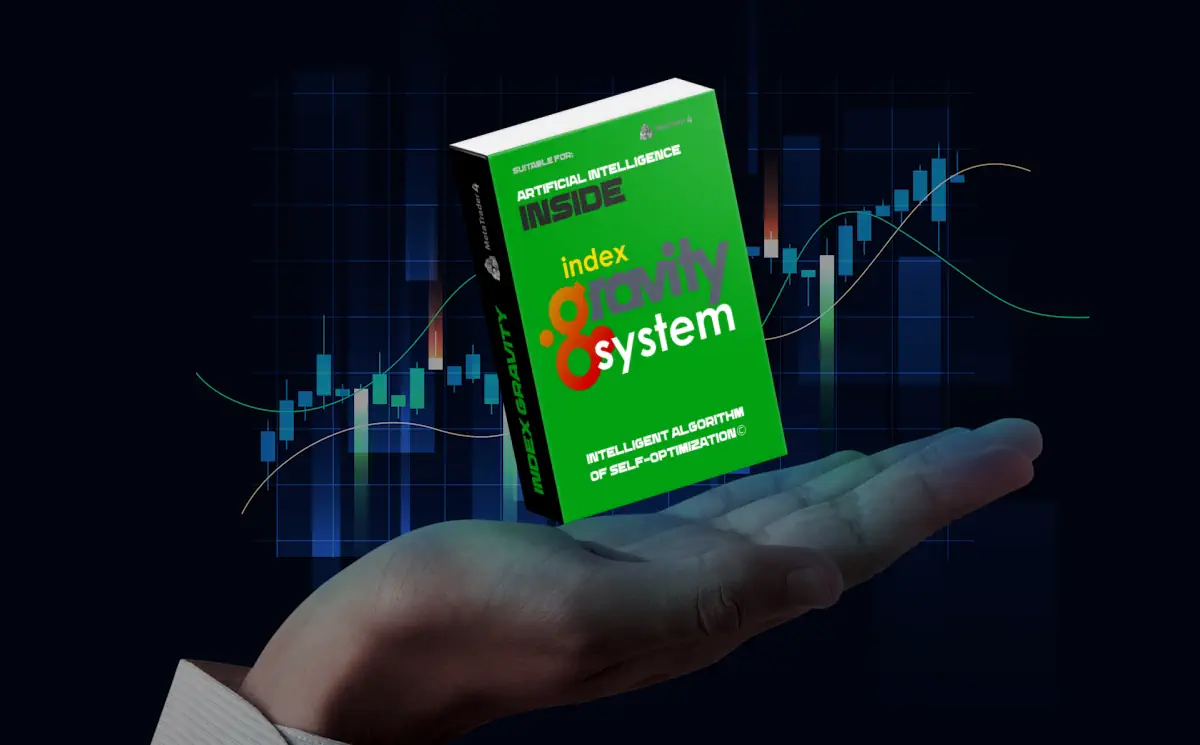
Manual for INDEX GRAVITY SYSTEM metatrader indicator
The INDEX GRAVITY SYSTEM is an «all-inclusive» metatrader indicator. During its creation I tried to solve several important subjects:
- to make the forex signal indicator which work in any market – for this We have integrated into the indicator an algorithm of self-optimization, which automatically adjusts the parameters of the indicator to obtain the maximum trading result, and in the case of transition of the market to another state, the profitable forex indicator was able to quickly adjust to market changes;
- to make the forex signal indicator easy to trade – for this We equipped the indicator with a system of pop-up alerts, visual forex arrows that show when to open trades and when to close trades;
- so that the trader could see the profitability of the system before using the metatrader indicator – for this We have integrated into the forex signal indicator a system of counting statistics, which shows the profitability of the system in the history of the last 5000 bars;
- to forex trading indicators brought a good amount of profit-about 10-30% per month
- to the forex arrows brought minimal losses.
So, first of all, we will describe in detail how this indicator works and what signals it gives.
Note. Each buyer of this metatrader indicator receives an additional professional Gravity Keltner indicator as a gift, which will help you correctly determine the boundaries of the price channel.


How does GRAVITY INDEX SYSTEM works
STRATEGY 1 – GRAVITY in a KELTNER CHANNEL
The main forex trading indicators of this system is the INDEX GRAVITY HISTOGRAM, which analyzes the entire basket of the market at once and reveals the moments when one particular currency begins to rise in price or become cheaper against other currencies.
When you put the metatrader indicator on a specific currency pair (for example – on AUDCAD), INDEX GRAVITY HISTOGRAM analyzes all currency pairs on your platform, where there is a currency AUD (AUDUSD, EURAUD, AUDCHF, AUDJPY, AUDNZD, etc.) and calculates an index for it. In parallel, the profitable forex indicator analyzes all currency pairs where there is CAD (CADCHF, EURCAD, GBPCAD, CADJPY, etc.) and calculates the index of this pair. After that, the indicator shows the ratio of the indices of the two currencies (AUD index and CAD index) in the form of a histogram:
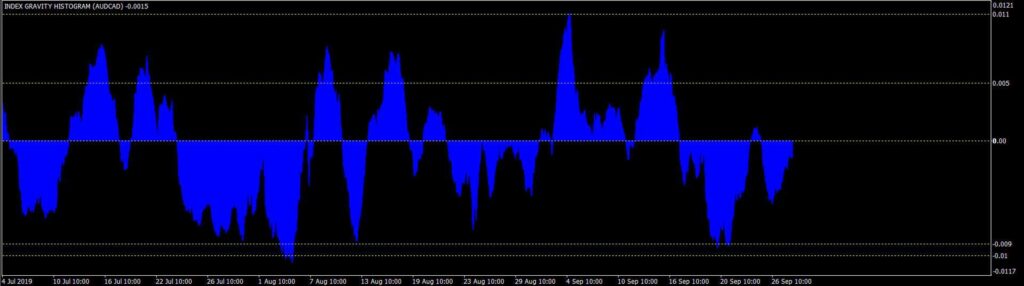
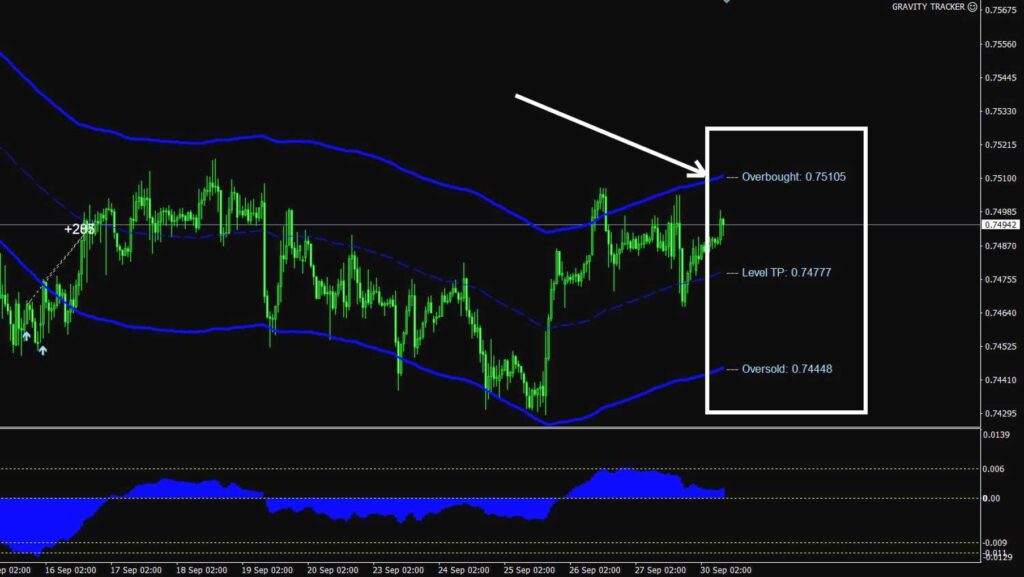
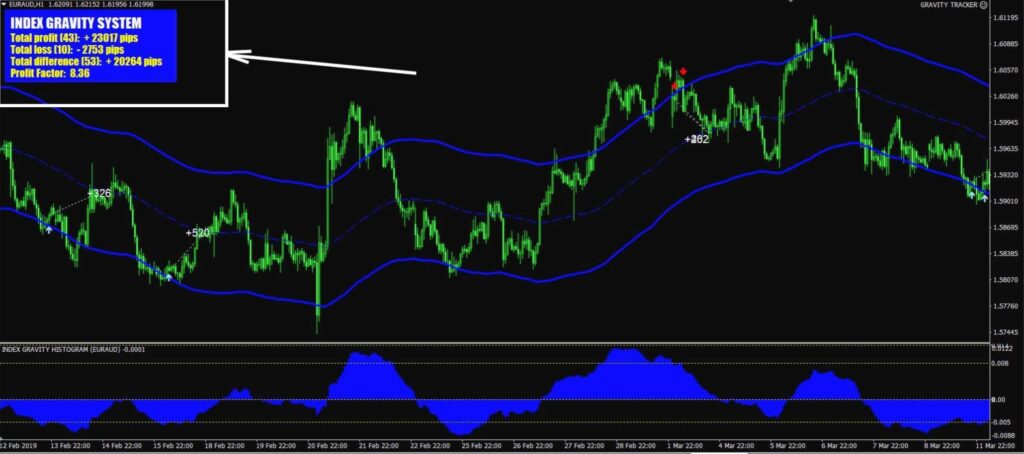
This histogram shows the moments when currency indices go from overbought to oversold and back. That is, the reversal moments of the quotes chart:
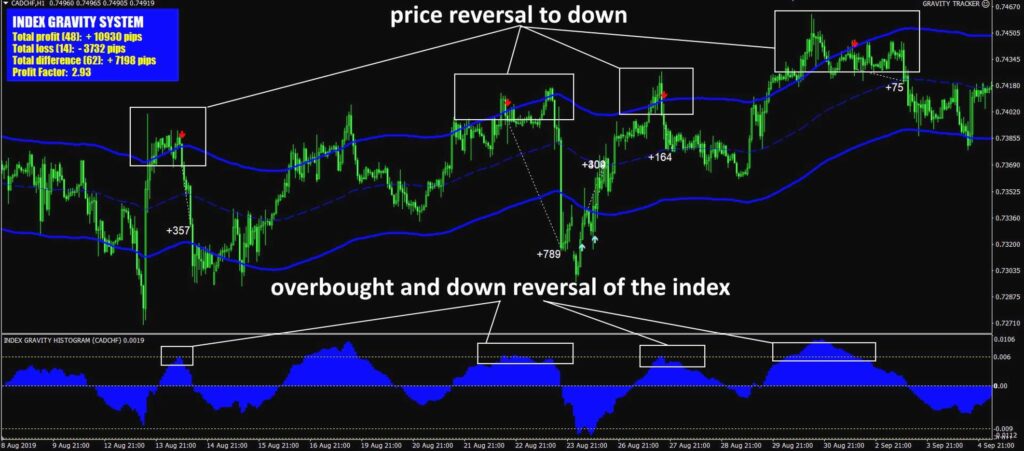
As you can see, the index histogram accurately identified the moments of the quotes reversal and showed the arrows where it is necessary to make deals
For convenience, the histogram is divided by special levels, which are the average levels of index reversal. These levels are determined for each currency pair automatically using self-optimization (how the self-optimization algorithm works, I will write below).
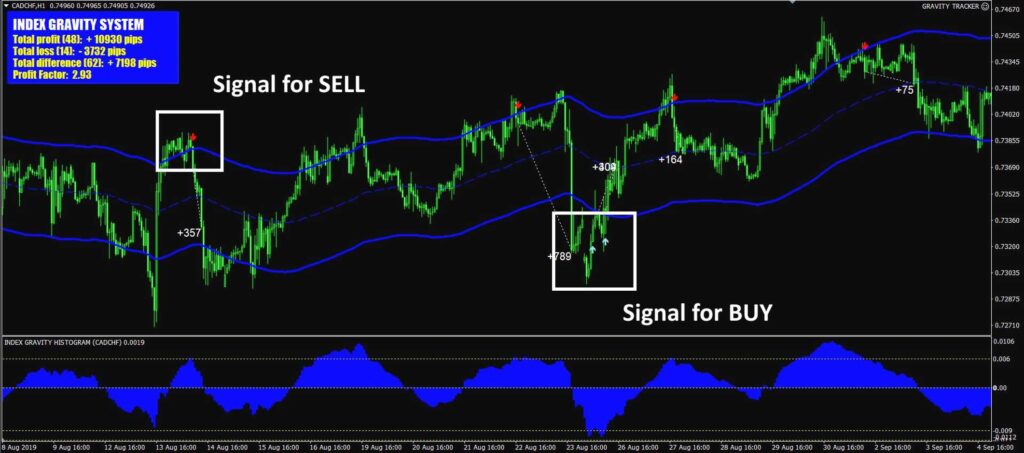
So, after the INDEX GRAVITY HISTOGRAM has detected a reversal of the index, the forex arrows indicator gives a signal for trading.
However, if this signal meets one important condition:
- For sell trades – if the quotes are above the boundary of the GRAVITY KELTNER channel (or the signal candle touches the border of the GRAVITY channel),
- For buy trades – if the quotes are below the boundary of the GRAVITY KELTNER channel (or the signal candle touches the border of the GRAVITY channel):
The GRAVITY KELTNER indicator is embedded inside the INDEX GRAVITY SYSTEM and displays the channel boundaries and the center line of the channel in this way):
OK, so that you can understand how this profitable Forex indicator works in reality, we made a video for you:
As we wrote above, each buyer of this forex signal indicator receives another gift – a professional Gravity Keltner indicator that will help visually track the boundaries of the price channel.
Thus, we use only those signals INDEX GRAVITY HISTOGRAM, which have a great potential reversal. As you know, quotes tend to periodically return to their average value. In simple words, the meaning of this system is to wait for the quotes to deviate from their average value by the maximum distance and make a deal that will be profitable because the quotes constantly return to their average value under the pressure of the “gravity” of the currency market.
Gravity Keltner filter allows us to use only those forex arrows signals that have a deal level at a sufficient distance from the average value of the asset price.
INDEX GRAVITY SYSTEM displays all signals for trading in the form of forex arrows of the corresponding direction on the quotes chart. Also, the indicator gives PUSH and email signals. Thus, you can receive signals on your smartphone and make deals using the mobile platform.
When to close deals?
The moment for closing your trades is the moment the price touches the center line of the GRAVITY KELTNER channel. In simple words – the moment when the force of gravity will return the price from the stage of maximum local deviation to its average value.
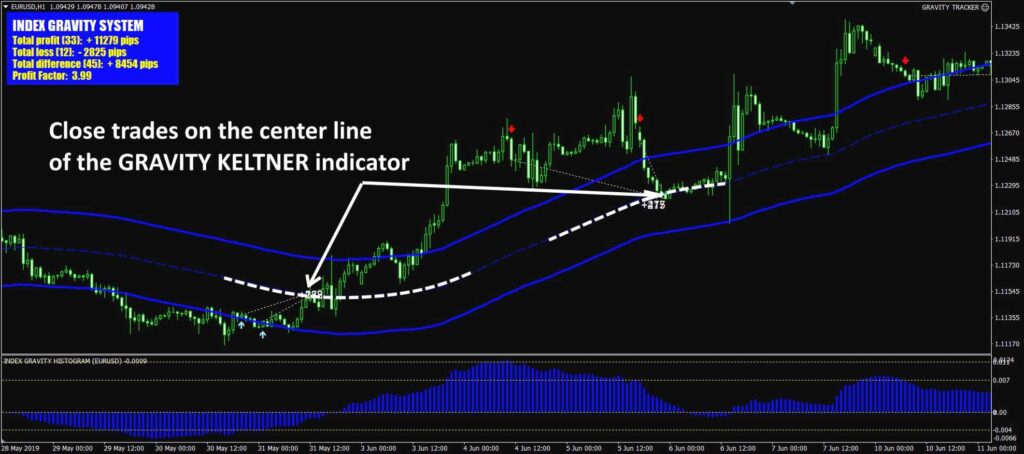
You can put TP on the level of the Central line of the channel manually.
OK, now that you understand how this metatrader indicator works, we will teach You how to set the forex trading indicators on a quote chart and run a self-optimization algorithm.
How to set up the INDEX GRAVITY SYSTEM indicator
NDEX GRAVITY SYSTEM is a multi-currency forex signal indicator which simultaneously assesses the entire market basket (all available currency pairs). Therefore, to start the profitable forex indicator operation, it is necessary:
Add all available currency pairs in the «Market Watch» tab:
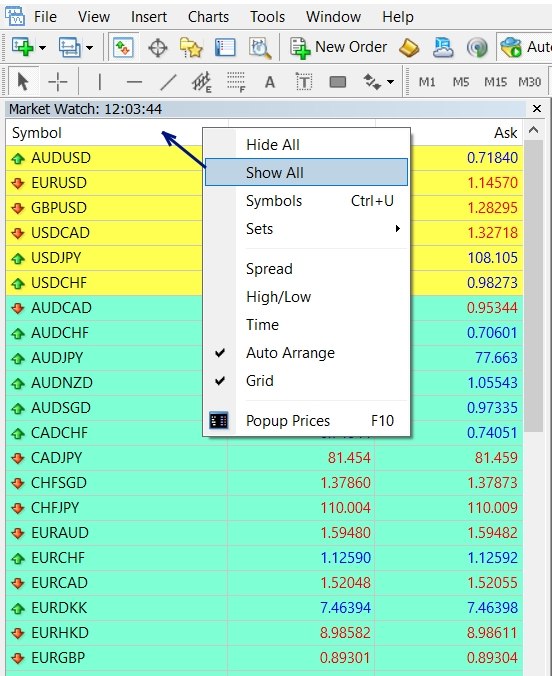
Before the first installation of the indicator, it is necessary to open all charts of quotes from the “Market Watch” tab so that your trading platform automatically downloads all the quotes history necessary for the indicator to work.
Pay attention to the name of the currency pairs in your terminal. Often brokerage companies add a special symbol – suffix to the name of currency pairs. For Example – EURUSDf, EURUSD_с, EURUSDm. Respectively – «_с», «m» – it’s a suffix.
If the name of the currency pairs on your platform differs from the traditional name, specify this suffix in the manual settings of the indicator:
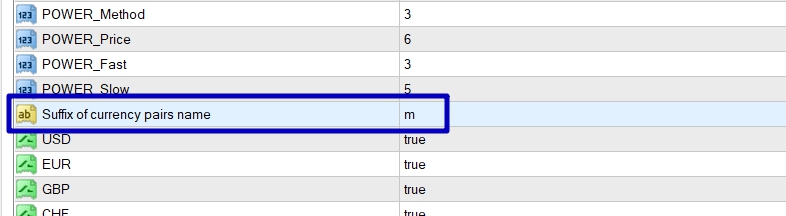
write in the manual settings of the indicator suffix «m» if the name – EURUSDm
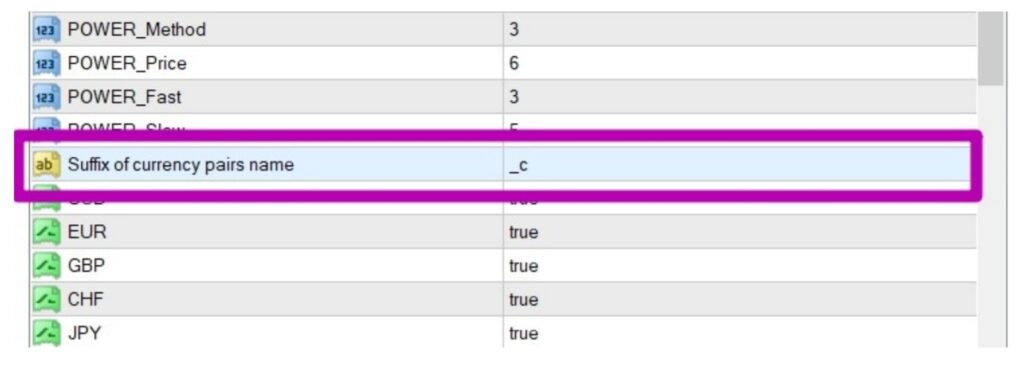
write in the manual settings of the indicator suffix «_c» if the name – EURUSD_c
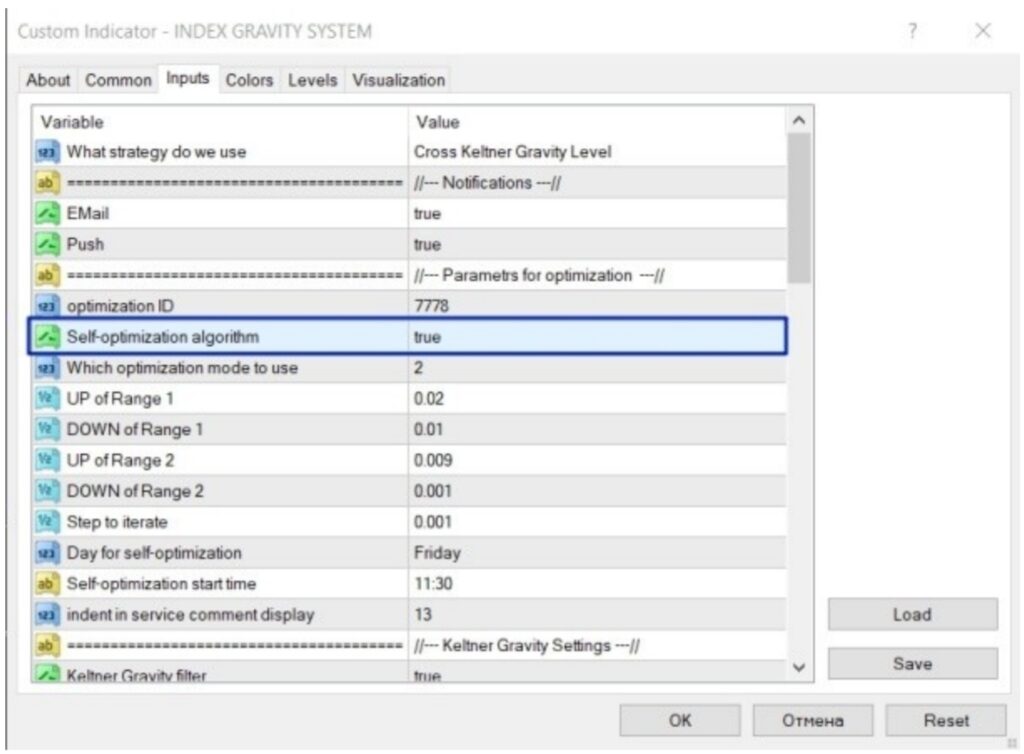
Once you have downloaded all the necessary history of quotations, you can self-optimize. For self-optimization it is necessary:
- Put the forex signal indicator on the quotes chart.
- For the “Self-optimization algorithm” variable, select “True” and click “OK” to apply the metatrader indicator:
After applying the forex arrows indicator with the self-optimization parameter enabled, optimization will start. Visually it will look like your platform is frozen. Do not worry, it is optimized. The average optimization time takes about 10-30 seconds. About 10-30 seconds after the indicator is applied, a message will appear stating that the self-optimization has been performed and the statistics of the optimized parameters will appear in the indicator statistics window:
The indicator writes all the optimization results to a special file and stores them in the “Files” folder in the root directory of your platform. This is done in order not to carry out self-optimization constantly, but to use the parameters that were optimized earlier (In the future this file will be constantly updated (every time a planned self-optimization takes place at a time of your choice).
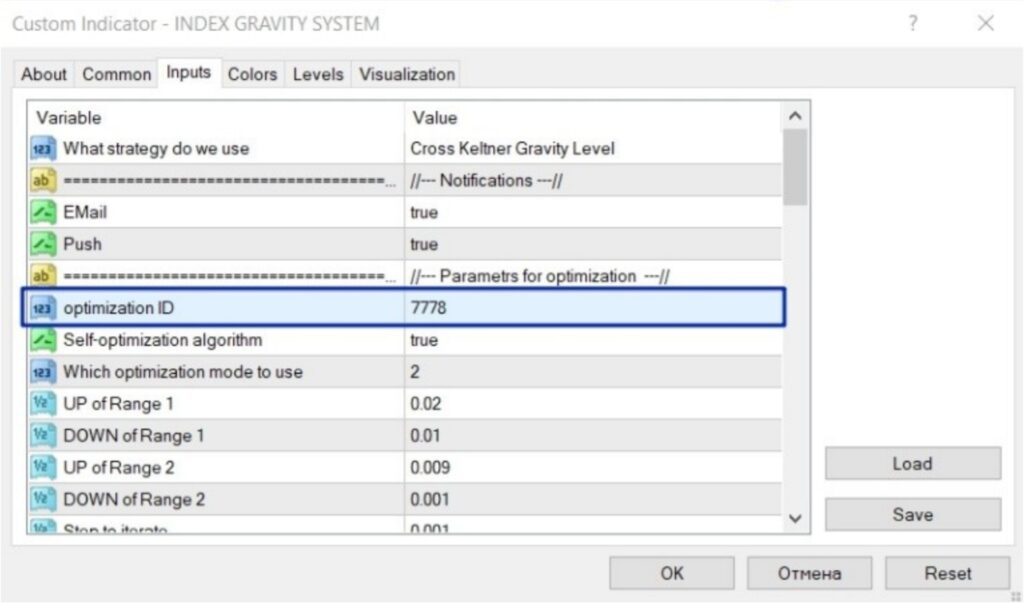
If you have already optimized for the H1 timeframe (or another timeframe) of a particular currency pair and now want to optimize for the H4 timeframe (or another timeframe), change the number for the «Optimization ID». This unique number helps the forex signal indicator to filter previously obtained results and does not allow to use the same optimization results on different timeframes.
It should be understood that the dynamics of the histogram movement differs significantly on different timeframes. By default, the indicator has settings for self-optimization on the H1 timeframe. If you want to optimize the forex trading indicators for other timeframes, it is best to use my set files to optimize different timeframes (these are 4 set-files for: M15, M30, H1 and H4).
The time of the planned optimization, you can any that you like. The default is Sunday 11:30 (platform time). At this time, the market is closed and self-optimization will not prevent your trading. Planned optimization will be performed every week at the time you specify. The main thing that at this moment your platform was functioned.
Please set for each price chart different time for planned self-optimization (the difference between the time can be 3-4 minutes) in order to reduce the load on the operating system of your computer. If you simultaneously turn on the optimization of 10-30 charts at once, your operating system may «hang»!
In any case, you can self-optimize the metatrader indicator at any time convenient for you. If you want to optimize the indicator ahead of time, then set the “optimization ID” variable to a new value and apply the indicator to the quote chart again. In this case, the indicator will re-enable the self-optimization algorithm. IMPORTANT! After self-optimization, the profitable forex indicator will stop using the signal levels that were previously set in the default settings. After optimization, the indicator will use new signal levels that are not visible visually on the indicator scale.
Installation of GRAVITY KELTNER indicator
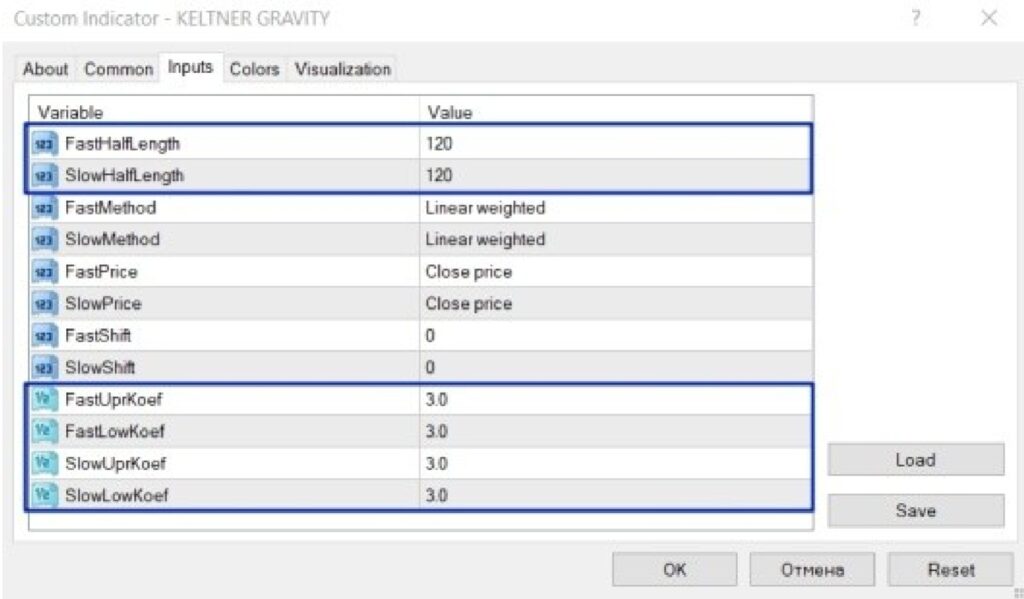
Install the GRAVITY KELTNER metatrader indicator on the quotes chart. At the same time, set the channel width and channel period for it to be the same as the channel width and channel period in the INDEX GRAVITY SYSTEM forex signal indicator!
Thus, GRAVITY KELTNER will be displayed on the quote chart exactly as it works inside the INDEX GRAVITY SYSTEM.